Joey Chakraborty

Turning a bioinformatics pipeline into a product scientists could act on

Context
A publicly traded drug discovery company had a bioinformatics pipeline, PrimeSeq, with no user interface and no place in its antibody discovery workflow.
Role
I identified the opportunity, led design of PrimeSeq’s first interface and its integration into the antibody discovery workflow, and later handed day-to-day design to a junior designer.
Impact
We shipped it before I left in early 2023, and PrimeSeq was used by customers including La Jolla Institute and Medical College of Wisconsin.
Built with
  • Figma
  • React
Timeline
About 9 months
Ship date
Late 2022
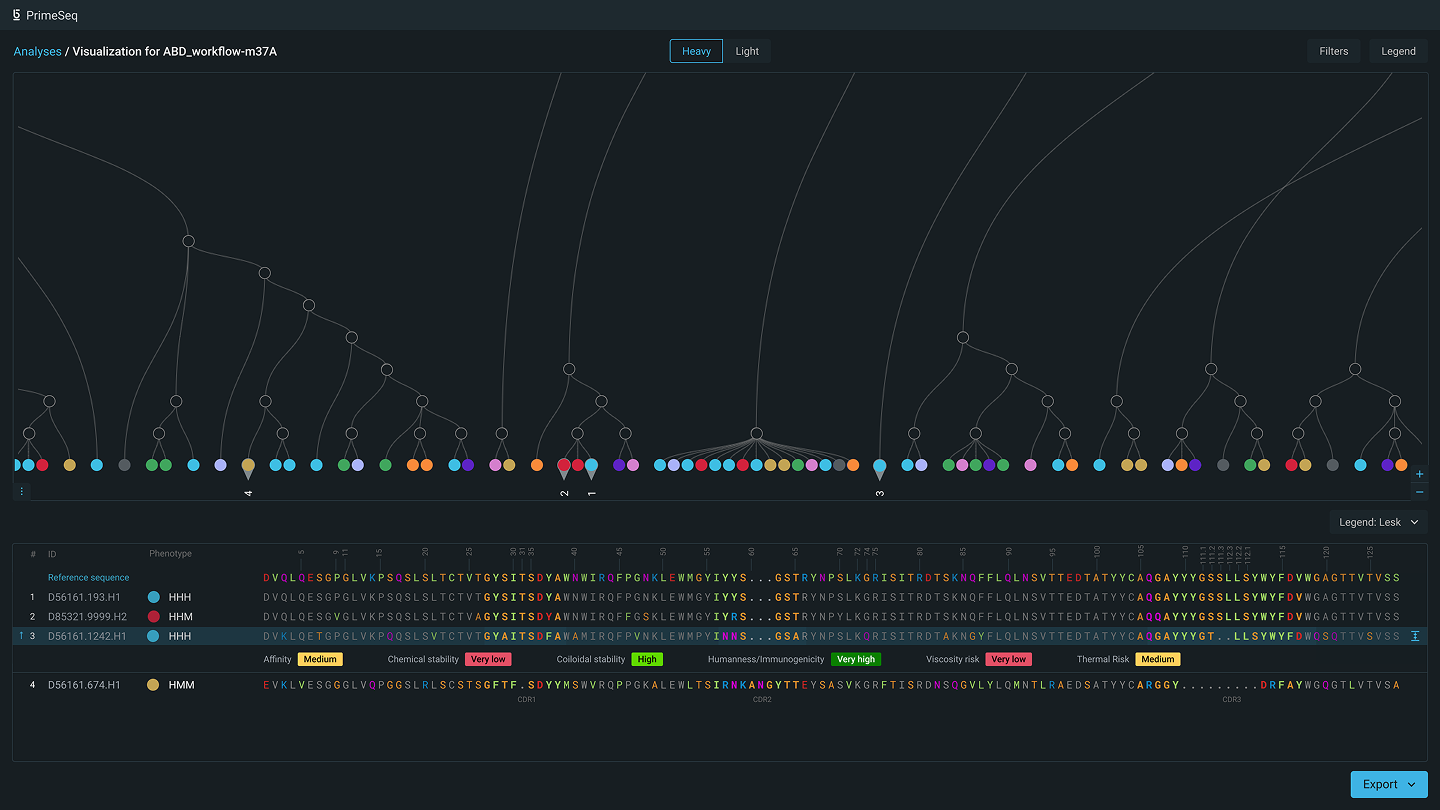
The PrimeSeq linked view in its dark theme: a tree of sequences across the top with four numbered leaves pinned, and below it their aligned sequences, one row expanded to show its property ratings, with an Export button.
PrimeSeq pane view: Dendrogram on top and multiple sequence alignment (MSA) pane on the bottom. Final designs that shipped.

The situation

Many signals, read one at a time

Choosing an antibody candidate means weighing phenotype, genotype, manufacturability, and stability across many options. The pipeline could produce the data, but it came out as reports, outside the workflow where scientists made the decision. The design problem was letting a scientist weigh it all together instead of one property at a time.

Two ways to draw the relationships
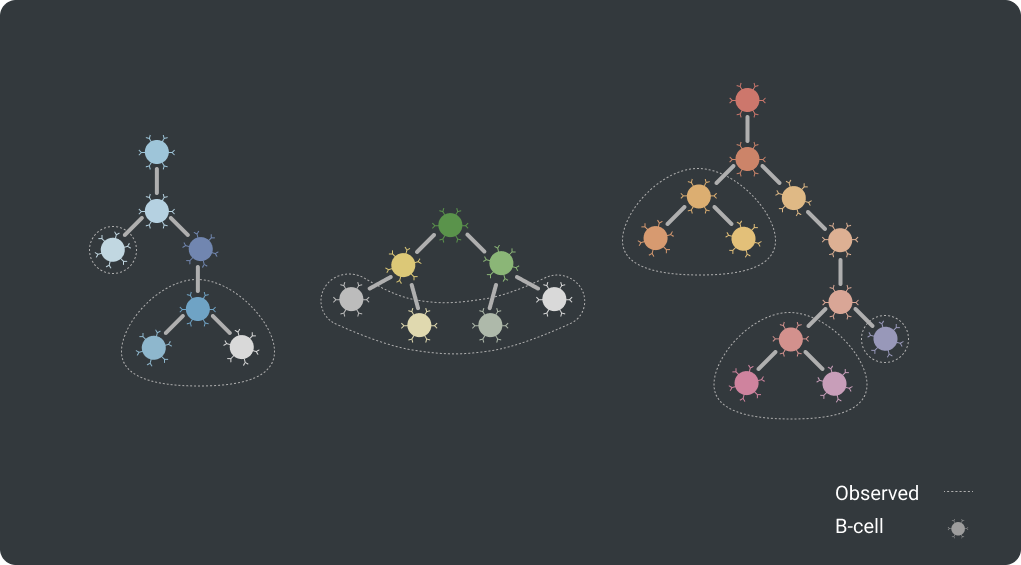
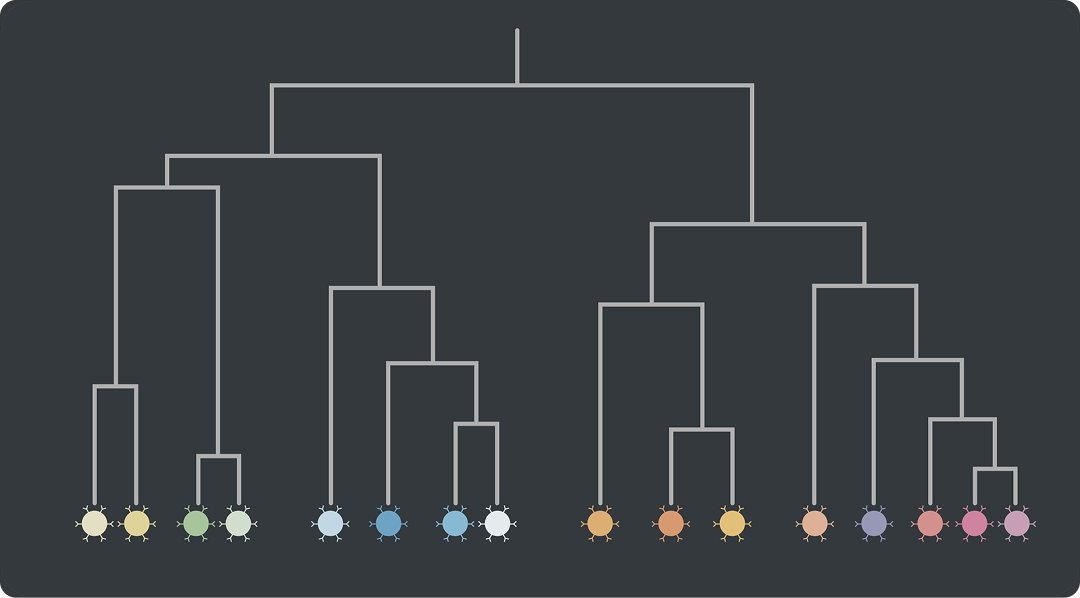
A lineage tree exploration: three small clusters of nodes connected as trees, with B-cells as solid nodes and observed nodes with dotted outlines.
Lineage tree Considered
A dendrogram exploration: one branching tree with colored cell nodes along the bottom.
Dendrogram Chosen

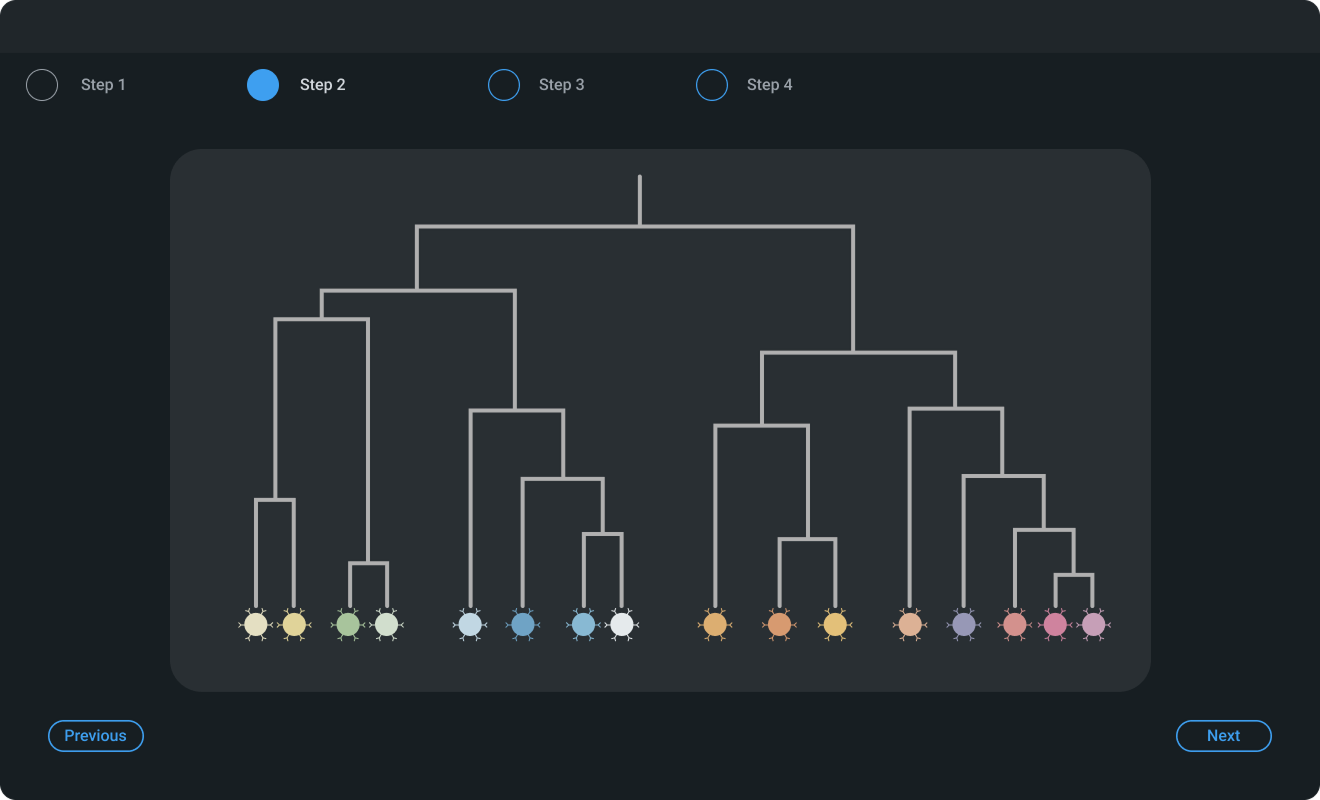
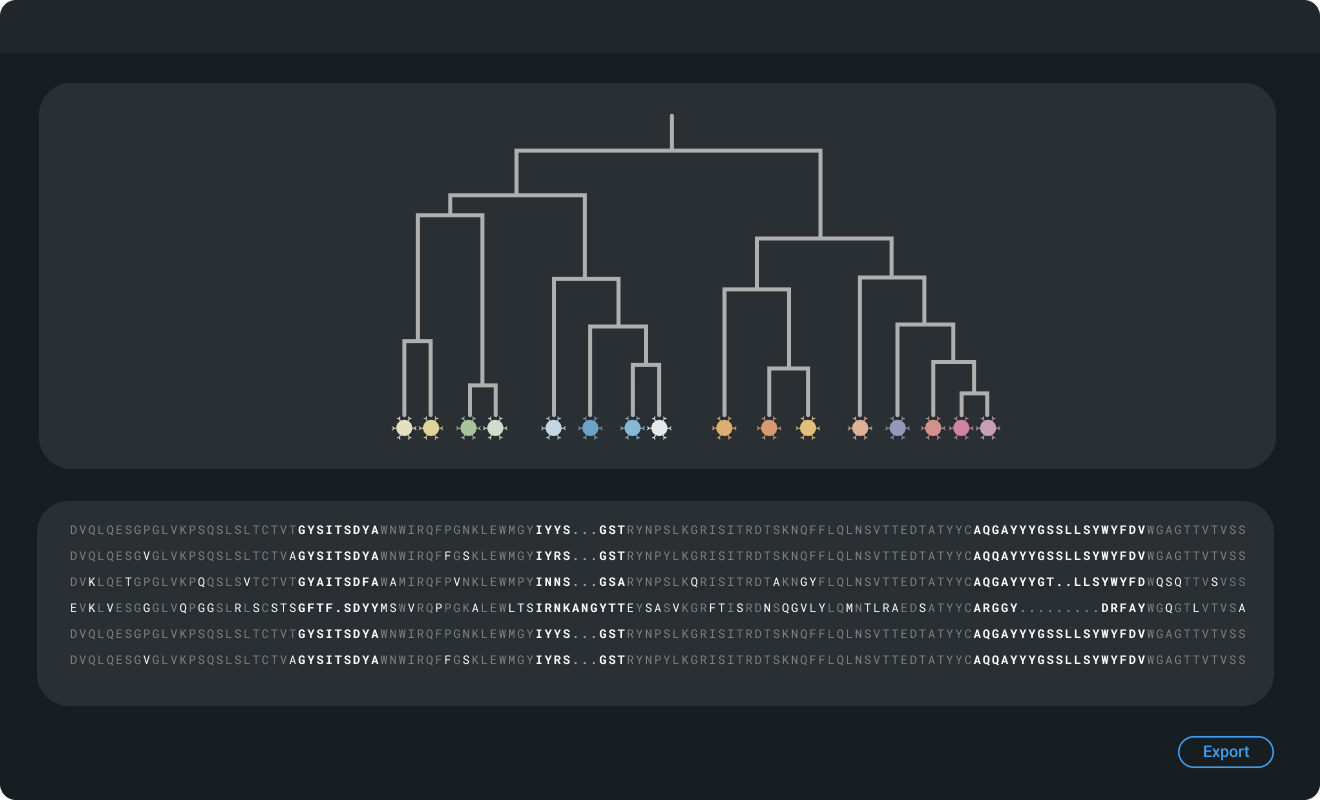
Two ways to lay it out

A wizard layout exploration: a four-step progress bar above the dendrogram, with Previous and Next buttons.
Wizard Considered
A panes layout exploration: the dendrogram above a table of sequences, with an Export button.
Panes Chosen
Early explorations. The dendrogram showed how every sequence relates to the others at once, and panes meant changing a selection never required going back a step.

The work

Finding the right view

The hard part was visual: finding a view that lets scientists compare candidates on several properties at once. We brought those signals into a single view, linked a tree of related sequences to a detailed table, and encoded where sequences diverge so the differences stand out.

Recreated with sample data. Before and after an internal biologist’s suggestion: lighting the full path of a selected node makes related sequences easier to find.

The work

Building in the open

We built the interface from zero with a focused team. I proposed showing work every two weeks to the company and every month to customers, and our PM set it up. That cadence let us test ideas with scientists before committing engineering time.

I led the design until the main elements were set, then made a junior designer the main design resource, with me as backup.
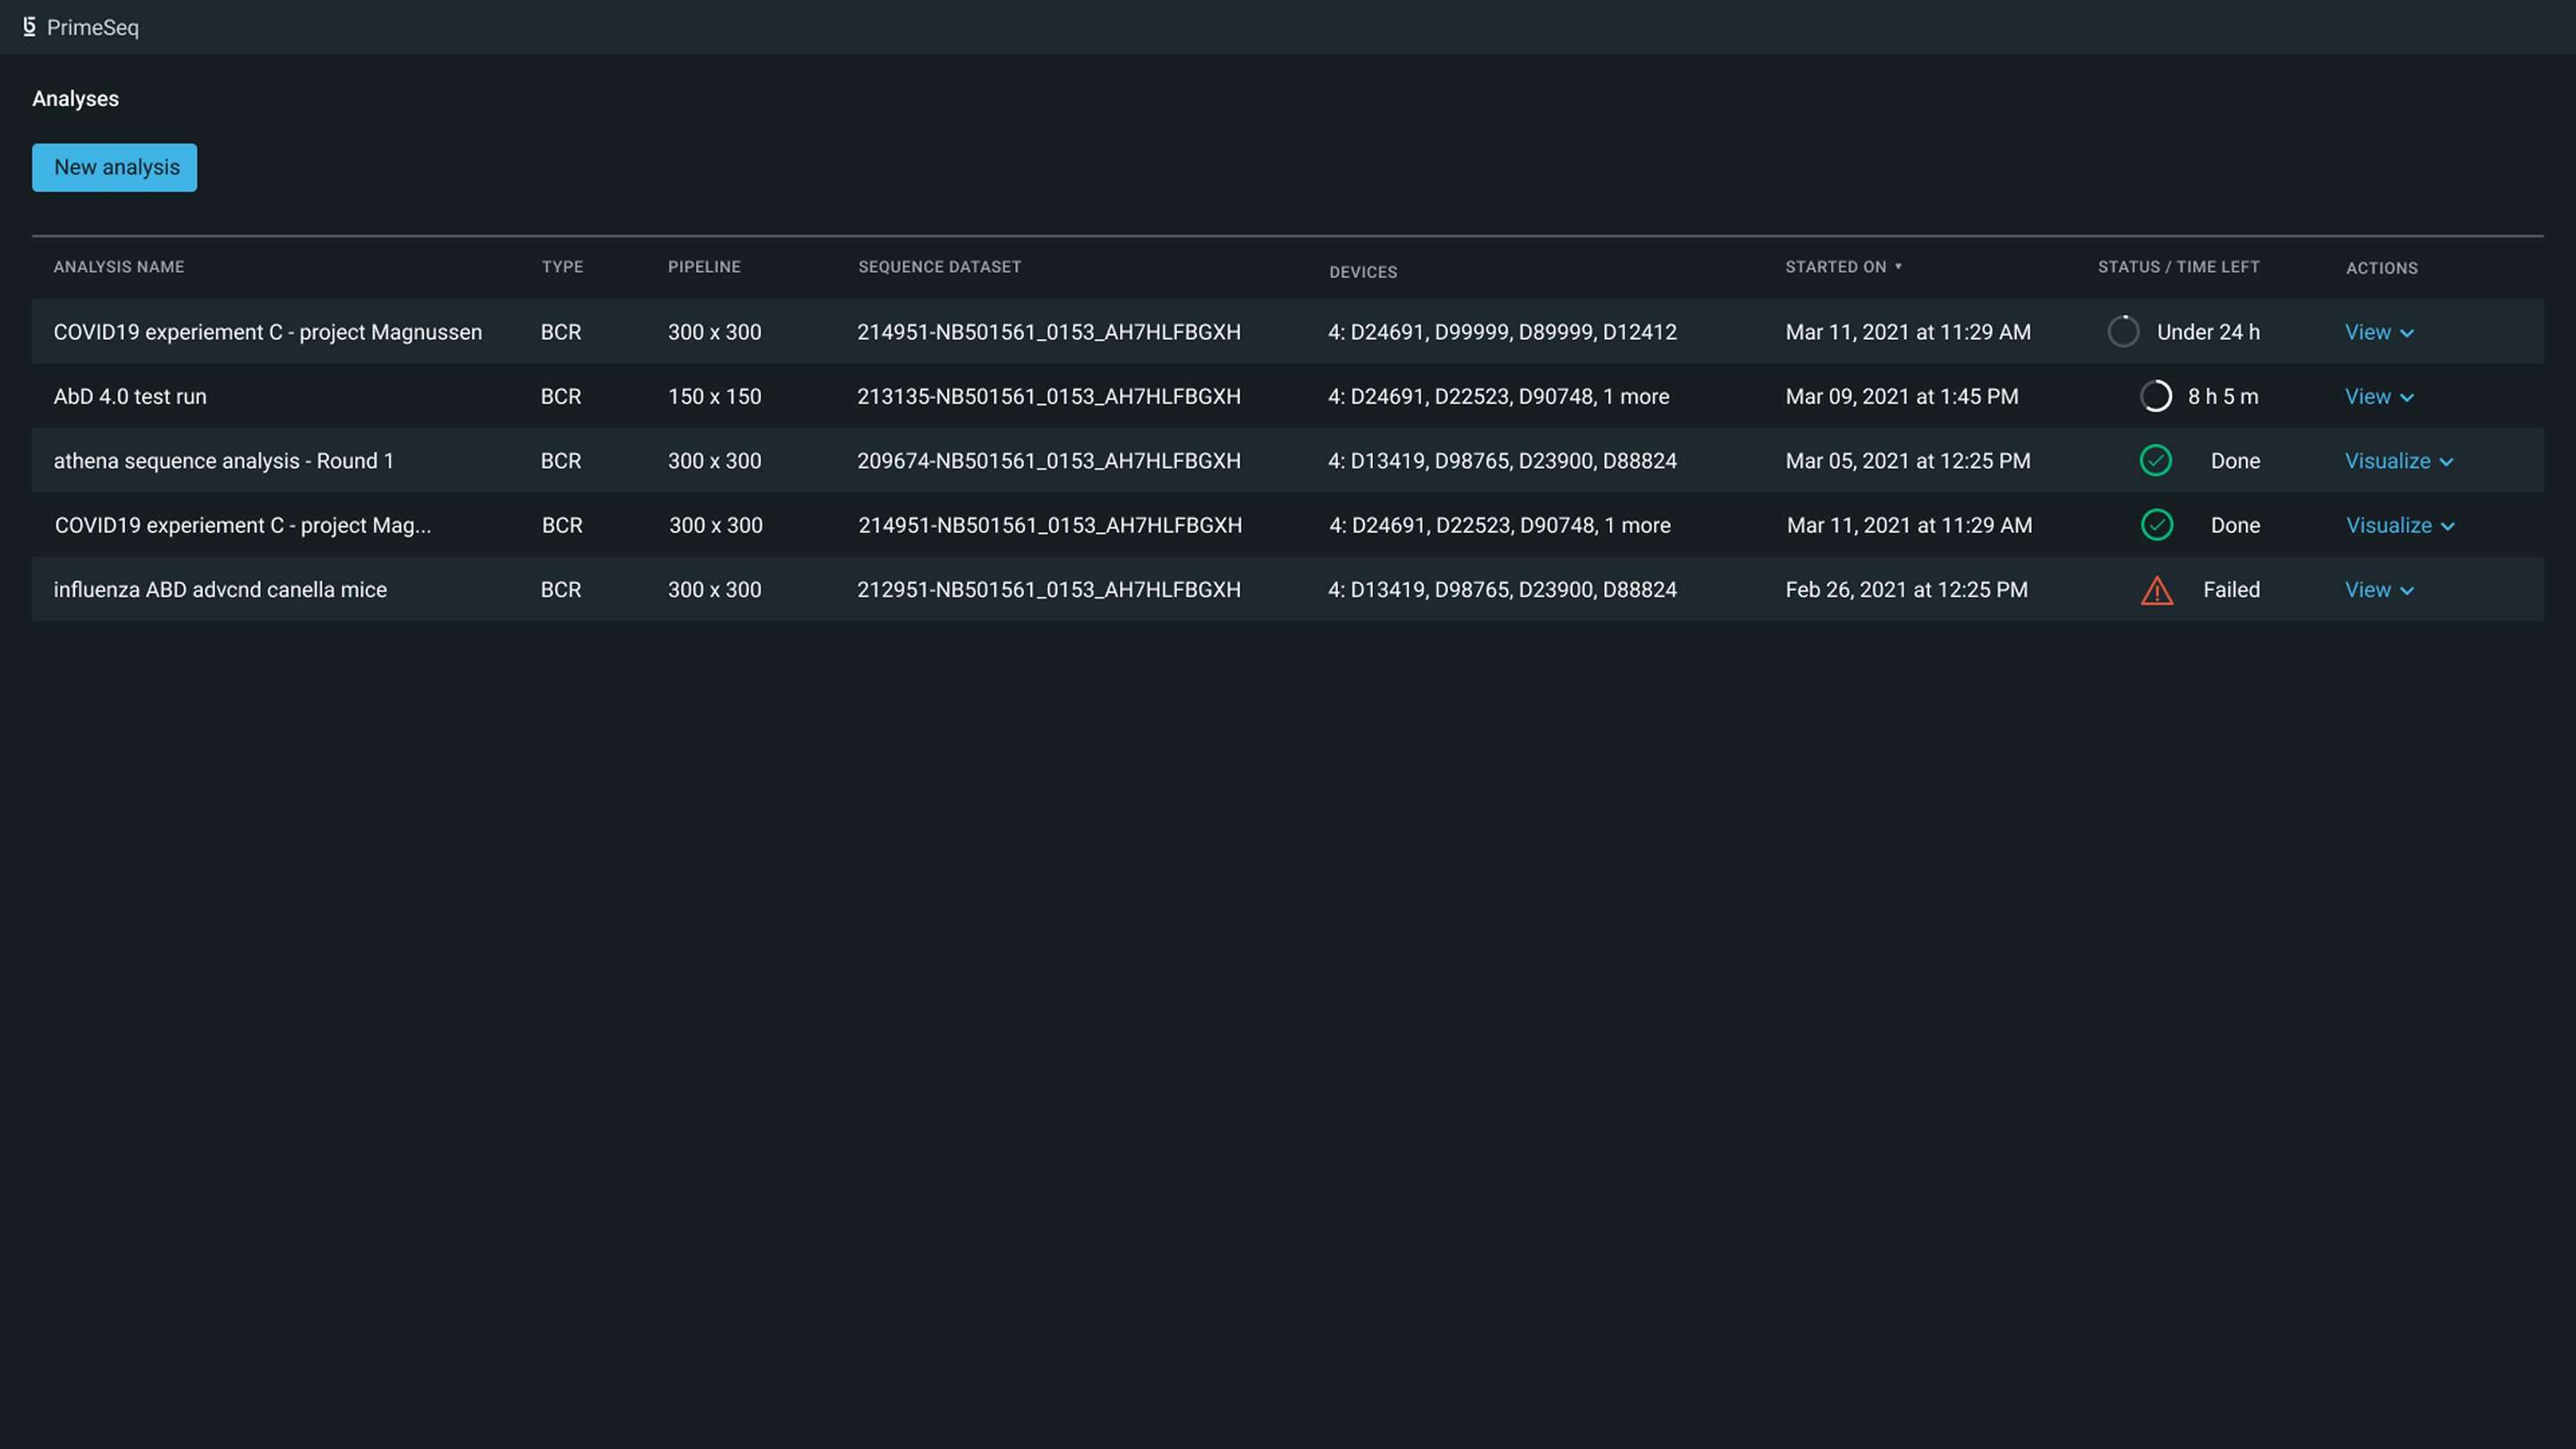
The PrimeSeq launch screen in its dark theme: a New analysis button above a table of five analyses with their type, pipeline, dataset, devices, start time, status, and actions.
The launch screen: where a scientist starts an analysis and follows it through. Final designs that shipped.

The outcome

Used by customers, copied by teams

We shipped it before I left in early 2023. The way we built it became the model other teams followed to validate ideas before investing in them.